El Niño has set a new record. Here is what the last three giants did to Britain's winters
NOAA's weekly El Niño reading has set a new high for the third week running, and its July–September index value is the highest for those months since 1950. Britain's weather records show what the last three giant events did here: a cold February in 1983, a record-warm February in 1998, and a flooded December with three named storms in 2015. Three cases are not a forecast.
NOAA's weekly Pacific reading reached +3.3°C in the week centred on 7 October, the highest in a series that starts in 1981, and its July–September index value of 2.16 is a record for those months. The Met Office calls this the strongest event in the observational record and expects the peak later this year. The last three giant El Niños gave Britain a cold, dry February (1983), its warmest February since 1884 (1998), and its warmest and wettest December with three named storms (2015). Two of the three winters were mild. Three cases are not a forecast.
By Tom Calder · Updated 15 October 2026 · Sourced to NOAA, the Met Office and the Environment Agency
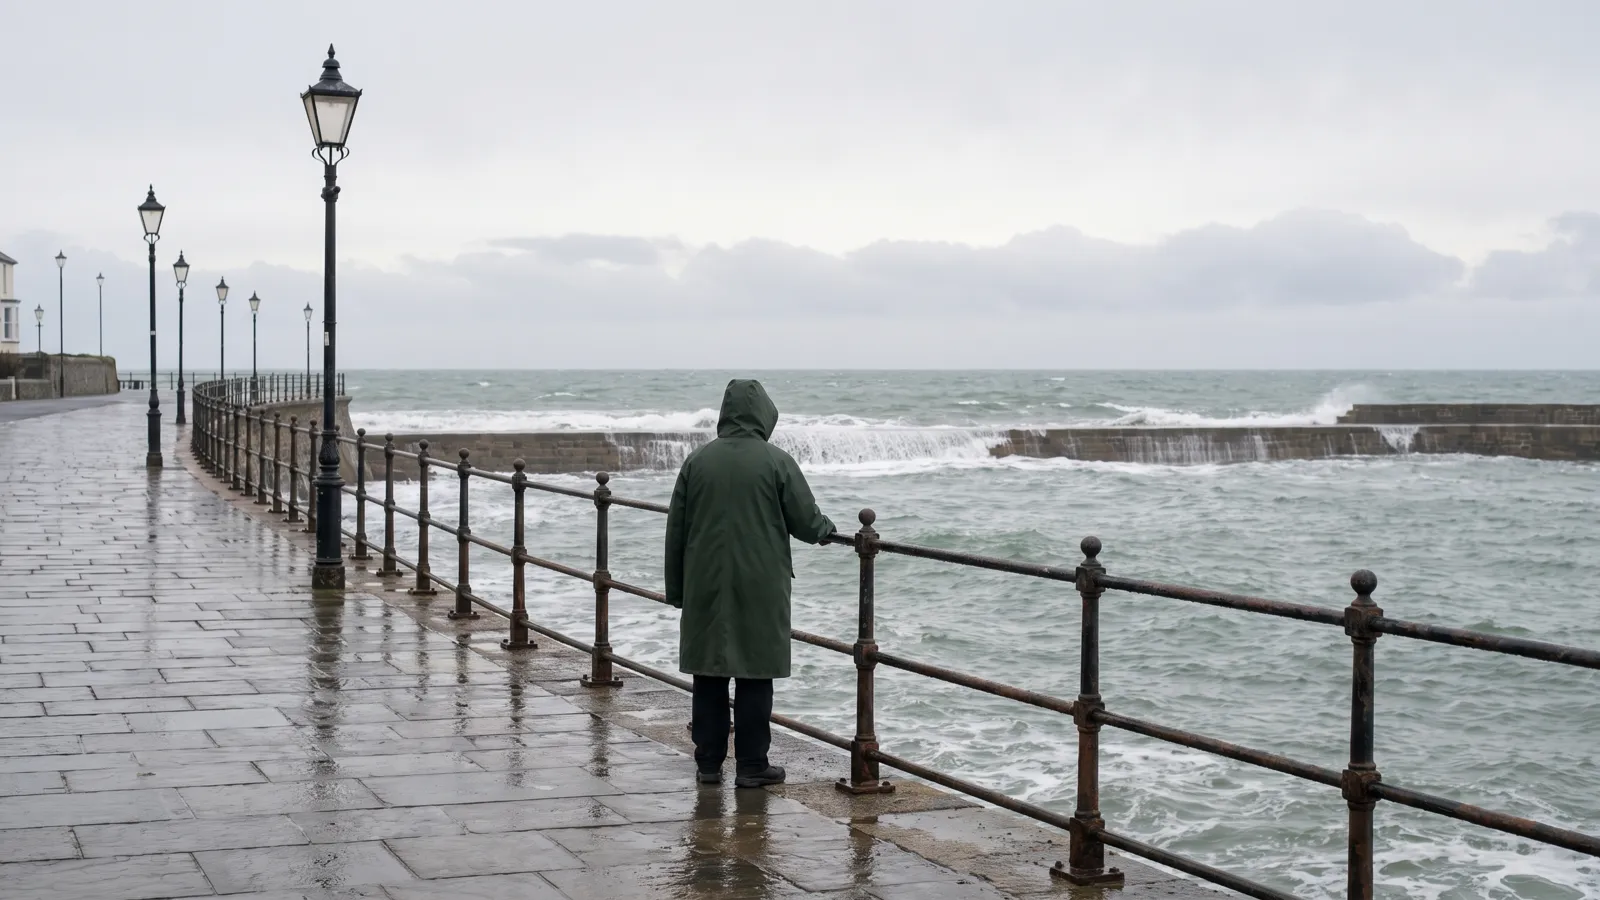
The highest weekly reading since NOAA's series began in 1981
NOAA's weekly reading of Pacific sea-surface temperature, the Niño 3.4 anomaly, has set a new high for the third week running. The week centred on 7 October 2026 came in at +3.3°C above the 1991–2020 average, after 3.2°C on 30 September and 3.1°C on 23 September.
The series starts in September 1981. Before this year its highest week was +3.0°C, in November 2015. The three highest weeks on record are now the last three.
NOAA's official three-month measure, the Oceanic Niño Index, agrees. July to September 2026 came in at +2.16°C, the highest for those months in an index that starts in 1950; the same months in 1997 reached 1.79 and 2015 reached 1.73.
On NOAA's index the event has passed the 1982–83 peak of 2.14, but not 1997–98 (2.37) or 2015–16 (2.59). The past giants all peaked around November to January, so this one's peak is still to come. Live figures are on our El Niño tracker.
NOAA's 8 October discussion keeps its El Niño Advisory: "El Niño continues to strengthen, with a strong-to-very strong El Niño likely through January-March 2027 (remaining greater than an 83% chance)." The next discussion is due on 12 November.
What the Met Office says it means for Britain
The Met Office said on 22 September that the event "has now exceeded previous records, making it the strongest event in the observational record", with the peak still to come later this year.
Its view of Britain is measured. "As the event approaches its winter peak, there is an increased likelihood of wetter and stormier conditions across north-west Europe, including the UK, during autumn and early winter." Then: "Later in the season, El Niño is associated with increased risk of cold snaps."
Britain's winter is also driven by the North Atlantic, which can override the Pacific. The next three-month outlook is due later this month; our explainer has the detail.
The Met Office's UK series (temperature from 1884, rainfall from 1836) and its Central England Temperature series (from 1659) show what the last three giants did here. "Average" below means 1991–2020: for the UK, December 4.2°C and 127mm of rain, January 3.9°C and 122mm, February 4.1°C and 96mm.
1982–83: mild and wet, then a cold, dry February
December 1982 was a little cold, at 3.4°C across the UK, with 141mm of rain. January 1983 then turned mild and wet: 5.4°C and 150mm, with Central England at 6.7°C.
February 1983 is where the winter turned. The UK averaged 1.3°C, the 18th-coldest February of 142 in the series, and Central England 1.7°C. It was dry too: 47mm of rain, about half the average.
A wet January and then a cold February is close to the shape the Met Office describes.
Home Alerts members
The full picture, for your home
Each week, what's happening across Britain set against your own address: your water company, your power network, fuel for your car and the gaps in your kit. Free for your own home. Opening in October; the first 100 on the list get in first.
Join the list →Britain's figures from our live trackers, 21 October.
1997–98: mild all the way to a record February
The second giant brought no cold at all. December 1997 averaged 5.1°C across the UK with 133mm of rain, and January 1998 4.3°C with 134mm. Both were milder than average and a little wetter.
Then came February 1998: 6.8°C, the warmest February in the UK series since 1884, a record it still holds (2024 is next at 6.3°C). Rain was 82mm, a little below average. In the Central England series back to 1659 it reached 7.3°C, joint fourth-warmest.
2015–16: a flooded December and three named storms
December 2015 averaged 7.9°C across the UK, the warmest December in the series since 1884; the next, 1934, was 6.8°C. Central England reached 9.7°C, the warmest December since 1659 and 1.6°C clear of the next.
The UK had 216mm of rain, the wettest December in a series back to 1836 and the second-wettest month of any kind in it. Only October 1903, at 220mm, was wetter.
Storm Desmond arrived on 5 and 6 December with gusts to 81mph and, in the Met Office's words, "405 mm rainfall recorded at Thirlmere in Cumbria in just 38 hours". It flooded 5,200 homes across Lancashire and Cumbria. On 5 December, 61,000 homes in Lancaster lost power when an electricity substation flooded.
Storm Eva followed on 24 December and Storm Frank on 29 and 30 December, with gusts to 85mph on South Uist. January 2016 stayed mild and wet, at 4.5°C and 178mm, and February 2016, at 3.8°C, was close to average. The cold never really arrived.
Three events, three different winters
Two of the three winters were mild overall. One turned cold, in February. The wet, stormy early-winter signal the Met Office describes showed up strongly in 2015 and in January 1983, less so in 1997.
Three cases are not a forecast. The climate has also warmed since 1982, which is one reason the average used here is 1991–2020.
England's reservoirs were at 54% on 6 October against a 75% average, and 10 water companies still have hosepipe bans (Environment Agency, 2 to 8 October); our hosepipe-ban tracker has the list. A wet winter is what they need. But a wet, stormy one also brings the 2015 problems: flooding and power cuts.
What to do
Nothing new. The usual kit: a torch and a radio that do not need the mains, a charged power bank, and a few days of water and food that needs no cooking.
Check your flood risk now, while it is dry. Our power-cut tracker shows cuts as they happen, and Home Alerts sends storm and flood alerts for your postcode.
Common questions
Does a record El Niño mean snow?
No. The Met Office says El Niño is associated with an increased risk of cold snaps later in the season, and with wetter and stormier conditions in autumn and early winter. Of the last three giant events, only 1983 brought a cold February, and the records we checked show cold and dry rather than snow. Two of the three winters were mild.
Is the UK weather record really that old?
The Met Office's UK temperature series starts in 1884 and its UK rainfall series in 1836. The Central England Temperature series goes back to 1659. NOAA's weekly Pacific series starts in September 1981 and its Oceanic Niño Index in 1950.
Is this the strongest El Niño on record?
The Met Office says the event "has now exceeded previous records, making it the strongest event in the observational record". On NOAA's weekly reading, +3.3°C is the highest since the series began in 1981, and its July–September index value of 2.16 is the highest for those months since 1950. The index peak of 2015–16, 2.59, has not been beaten; past giants peaked around November to January, so this one's peak is still to come.
Will a wet winter end the hosepipe bans?
We do not know. England's reservoirs were at 54% on 6 October against a 75% average, and 10 water companies still had hosepipe bans in the Environment Agency's report for 2 to 8 October. A wet winter is what they need. Those figures are for England only.
Sources (10)
- NOAA Climate Prediction Center — Weekly Niño indices, wksst9120.for (read 15 October 2026)
- NOAA Climate Prediction Center — Oceanic Niño Index (read 15 October 2026)
- NOAA Climate Prediction Center — ENSO diagnostic discussion (8 October 2026)
- Met Office — Record-breaking El Niño surpasses previous benchmarks (22 September 2026)
- Met Office — What does the latest long-range forecast tell us and what role could El Niño play this autumn? (11 September 2026)
- Met Office — HadUK-Grid UK mean temperature series (read 15 October 2026)
- Met Office — HadUK-Grid UK rainfall series (read 15 October 2026)
- Met Office Hadley Centre — Central England Temperature, monthly means (read 15 October 2026)
- Met Office — UK storm season 2015/16 (read 15 October 2026)
- Environment Agency — Dry weather and drought in England, 2 to 8 October 2026 (read 15 October 2026)
PreparedBritain is independent and not affiliated with HM Government.
See our checks first on Google. Add PreparedBritain as a preferred source and Google will show our stories to you more often in Top Stories.

The Emergency Kit Checklist
The GOV.UK Prepare essentials on one printable page — tick them off as you go and keep it with the kit. Free, no catch.
Download it straight away. We'll also send the occasional briefing when something genuinely matters — severe weather, live incidents, real price drops. Nothing else.
Latest from our live data
All stories → News · 21 OctOnly 4 in 100 adults have three days of bottled water at home, the government's survey shows
 News · 21 OctFood inflation held at 1.3%. Wholesale cabbage and cauliflower are up a third. Both are true
 News · 21 OctAldi recall: shoppers warned of hairdryer electric shock or fire risk. How to check yours
Keep reading
All planning & the national picture guides →A lab worker in Siberia has died of a suspected plague infection. What does it mean for the UK?
A 28-year-old laboratory worker at a plague research institute in Irkutsk died in the night of 1–2 October,…
Bug-out bag vs grab bag: what the UK actually recommends
The UK’s version of a bug-out bag is a grab bag for leaving home quickly. What GOV.UK and the Environment Agency say…
Is Britain in a wildfire crisis, and is 2026 the worst year on record?
The Liberal Democrats have called it “Britain’s Wildfire Crisis”, with 1.8 million homes exposed and the most…