England's barley and oat harvests are the smallest since 2012, Defra figures show
Defra's provisional estimates give England its smallest barley and oat harvests since 2012 after a hot, dry growing season. Feed, fertiliser and wholesale vegetable prices are up on a year ago, while shop food prices rose 1.3% in the year to August.
England's barley harvest is down 11% and its oat harvest 29%, the smallest since 2012. The soil is still drier than normal, and feed, fertiliser and wholesale vegetable prices are up on a year ago. Shop food prices rose 1.3% in the year to August; September's figures are due on 21 October.
By Tom Calder · Updated 15 October 2026 · Sourced to Defra, the ONS, the UK Centre for Ecology & Hydrology and the European Drought Observatory
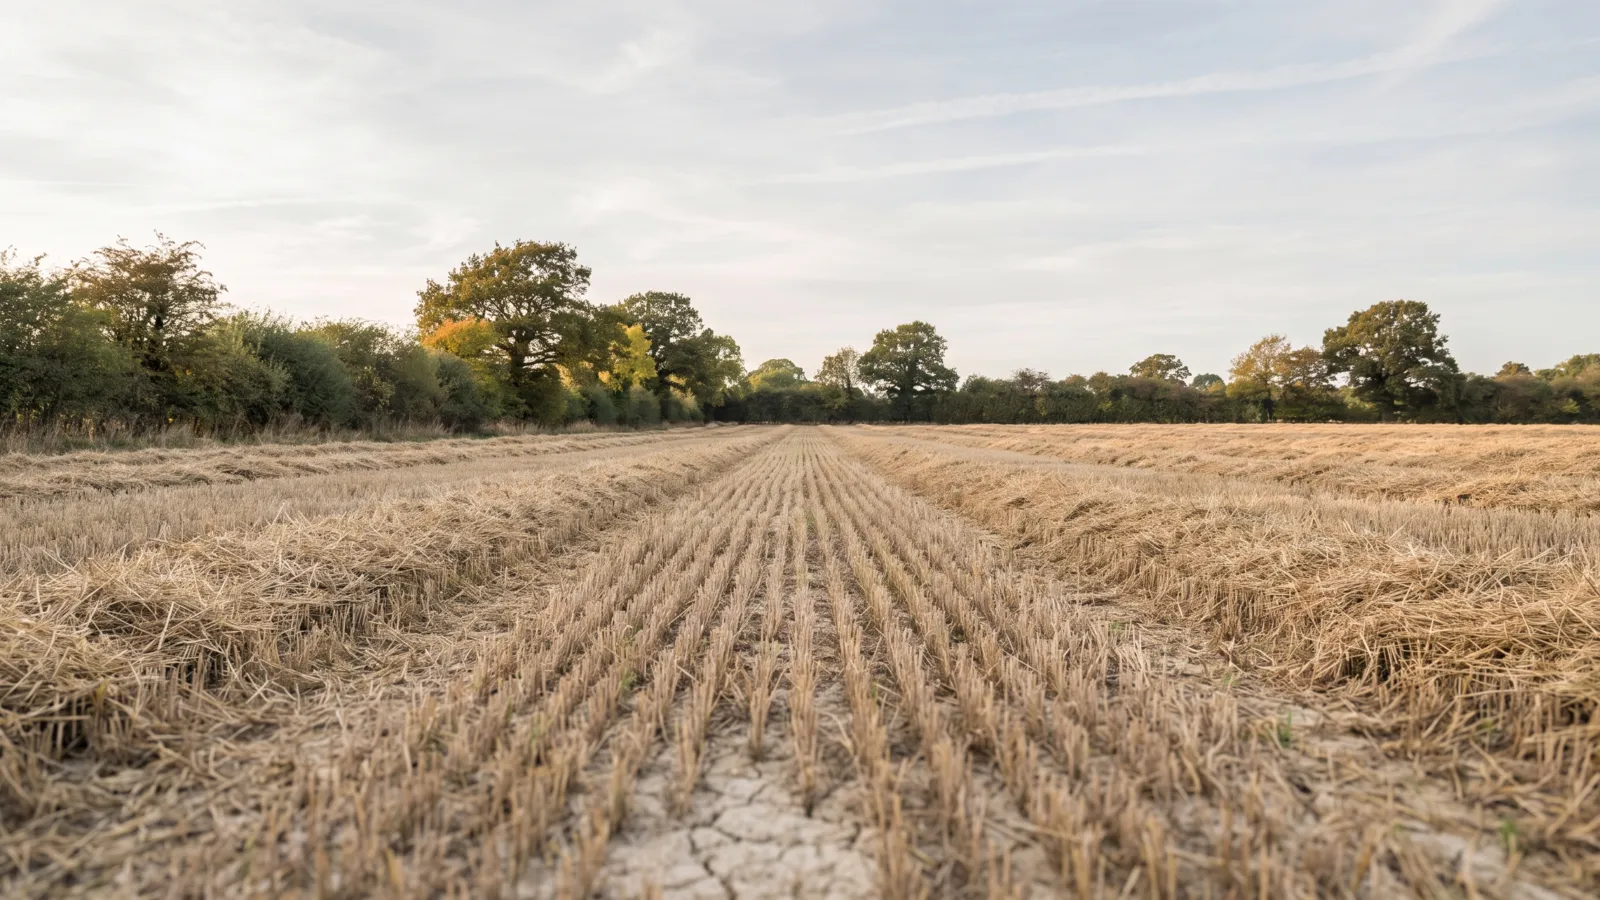
The smallest barley and oat harvests since 2012
England's barley and oat harvests this year were the smallest since 2012, according to provisional estimates published by Defra on 8 October. The department says "the hot weather and limited rainfall during the growing season hampered the 2026 cereal and oilseed harvest".
Barley came in at 3.7 million tonnes, down 11% on 2025. Spring barley fell 23%, while winter barley rose 1.7%. Oats fell further: 527,000 tonnes, down 29%, as the area fell 21% and the yield 11%.
Not every crop fell. Wheat was up 0.8% at 10.8 million tonnes, and oilseed rape rose 43% to 1.0 million tonnes. Northern regions generally fared slightly better than southern ones.
The figures are for England only and are provisional. UK figures, adding Scotland, Wales and Northern Ireland, follow on 10 December, when England's numbers can be revised.
The soil is still drier than normal
On our reading of UK Centre for Ecology & Hydrology data from its COSMOS-UK monitoring sites, 24 of 28 English sites read drier than normal for the time of year in the week to 13 October. We compare each site with the same week in at least five previous years. The median English site was 8.1 percentage points below normal.
Scotland, Wales and Northern Ireland were mostly normal, with 1 of 11 sites reading drier.
In the 10 days to 20 September, the European Drought Observatory's Combined Drought Indicator put 88% of the 65 fixed farmland points we follow in Great Britain in its "warning" category. Those are shares of points, not of farmland area.
Home Alerts members
The full picture, for your home
Each week, what's happening across Britain set against your own address: your water company, your power network, fuel for your car and the gaps in your kit. Free for your own home. Opening in October; the first 100 on the list get in first.
Join the list →Britain's figures from our live trackers, 21 October.
What farmers are paying
Defra's average animal feed prices for Great Britain in August put feed barley at £175 a tonne, up 20% on August 2025 (£146.36). Feed wheat was £197.95, up 18% (£167.95), and soya bean meal £356.20, up 21% (£294.80).
Defra's agricultural price indices for the UK show fertiliser up 13% in July against July 2025, energy and fuel up 14%, and all farm inputs up 6%.
What farmers are paid has not all moved one way. Farm-gate prices for cereals were up 7% and fresh vegetables up 10%. Potatoes were down 18%.
Wholesale vegetables cost more than a year ago
At the wholesale markets in England and Wales, Defra's prices for 12 October against 13 October 2025 show white cabbage up 35%, cauliflower up 33%, parsnips up 26%, brown onions up 24% and carrots up 19%. Pears were down 12%.
These are wholesale market prices, not shop prices.
Shop prices have barely moved so far
The latest shop-price figures, from the ONS for August, put food and non-alcoholic drinks 1.3% higher than a year earlier, vegetables up 2.1% and bread and cereals up 1.3%. All items were up 3.1%.
So the gap is plain: many farm and wholesale prices are climbing, and shop prices have not followed so far. The ONS publishes September's figures on 21 October.
What it means for households
Nothing that calls for a change in how you shop. The picture is mixed: potatoes were cheaper at the farm gate and pears cheaper at wholesale, even as cabbage, cauliflower and carrots cost more. There is no reason to buy more than usual.
Worth watching: the ONS shop-price figures on 21 October, Defra's UK-wide harvest figures on 10 December, and the soil readings through the winter.
All of these figures sit together on our live harvest tracker, which updates as each source publishes.
Common questions
Do these figures cover the whole UK?
No. Defra's 8 October estimates are for England only and provisional. UK figures follow on 10 December 2026, when England's can be revised.
Are the vegetable rises what I will pay in the shops?
No. Those are wholesale market prices in England and Wales. The ONS measures shop prices: in August, vegetables were up 2.1% on a year earlier.
How do you know the soil is drier than normal?
It is our reading of UK Centre for Ecology & Hydrology COSMOS-UK data, not UKCEH's own claim: each site is compared with the same week in at least five previous years.
Sources (7)
- Defra — Provisional cereal and oilseed production estimates for England 2026 (read 15 October 2026)
- Defra — Animal feed prices, Great Britain, August 2026 (read 15 October 2026)
- Defra — Agricultural price indices, UK, July 2026 (read 15 October 2026)
- Defra — Wholesale fruit and vegetable prices, weekly average, England and Wales (read 15 October 2026)
- ONS — Consumer price inflation, UK, August 2026 (read 15 October 2026)
- UK Centre for Ecology & Hydrology — COSMOS-UK soil moisture monitoring (read 15 October 2026)
- European Drought Observatory — Combined Drought Indicator (Copernicus Emergency Management Service, European Commission Joint Research Centre) (read 15 October 2026)
PreparedBritain is independent and not affiliated with HM Government.
See our checks first on Google. Add PreparedBritain as a preferred source and Google will show our stories to you more often in Top Stories.

The Emergency Kit Checklist
The GOV.UK Prepare essentials on one printable page — tick them off as you go and keep it with the kit. Free, no catch.
Download it straight away. We'll also send the occasional briefing when something genuinely matters — severe weather, live incidents, real price drops. Nothing else.
Latest from our live data
All stories → News · 21 OctOnly 4 in 100 adults have three days of bottled water at home, the government's survey shows
 News · 21 OctFood inflation held at 1.3%. Wholesale cabbage and cauliflower are up a third. Both are true
 News · 21 OctAldi recall: shoppers warned of hairdryer electric shock or fire risk. How to check yours
Keep reading
All food & growing guides →25-year shelf life food: what really lasts, and do you need it?
What a 25-year shelf life really promises, which foods keep for years, what heat, air, light and damp do, the cost…
Will there be food shortages this Christmas? Turkeys, vegetables and prices, checked
Most years bring a “Christmas shortage” headline. As of 14 October 2026 there is no turkey supply warning, one bird…
Is there going to be a milk shortage in the UK?
A “milk shortage warning” is in the headlines as drought cuts what dairy farms produce. Deliveries are down a few…